Halving Starko Dashboard Load Time: Three Rounds of Fixes
We halved the time the Starko dashboard takes to load with its data on screen, from a median of 2255 ms to 1097 ms on local production builds, by moving React Query reads off Next.js Server Actions and onto a Route Handler that runs reads concurrently. Two further rounds made repeat visits and Starko AI sessions paint from a local snapshot.
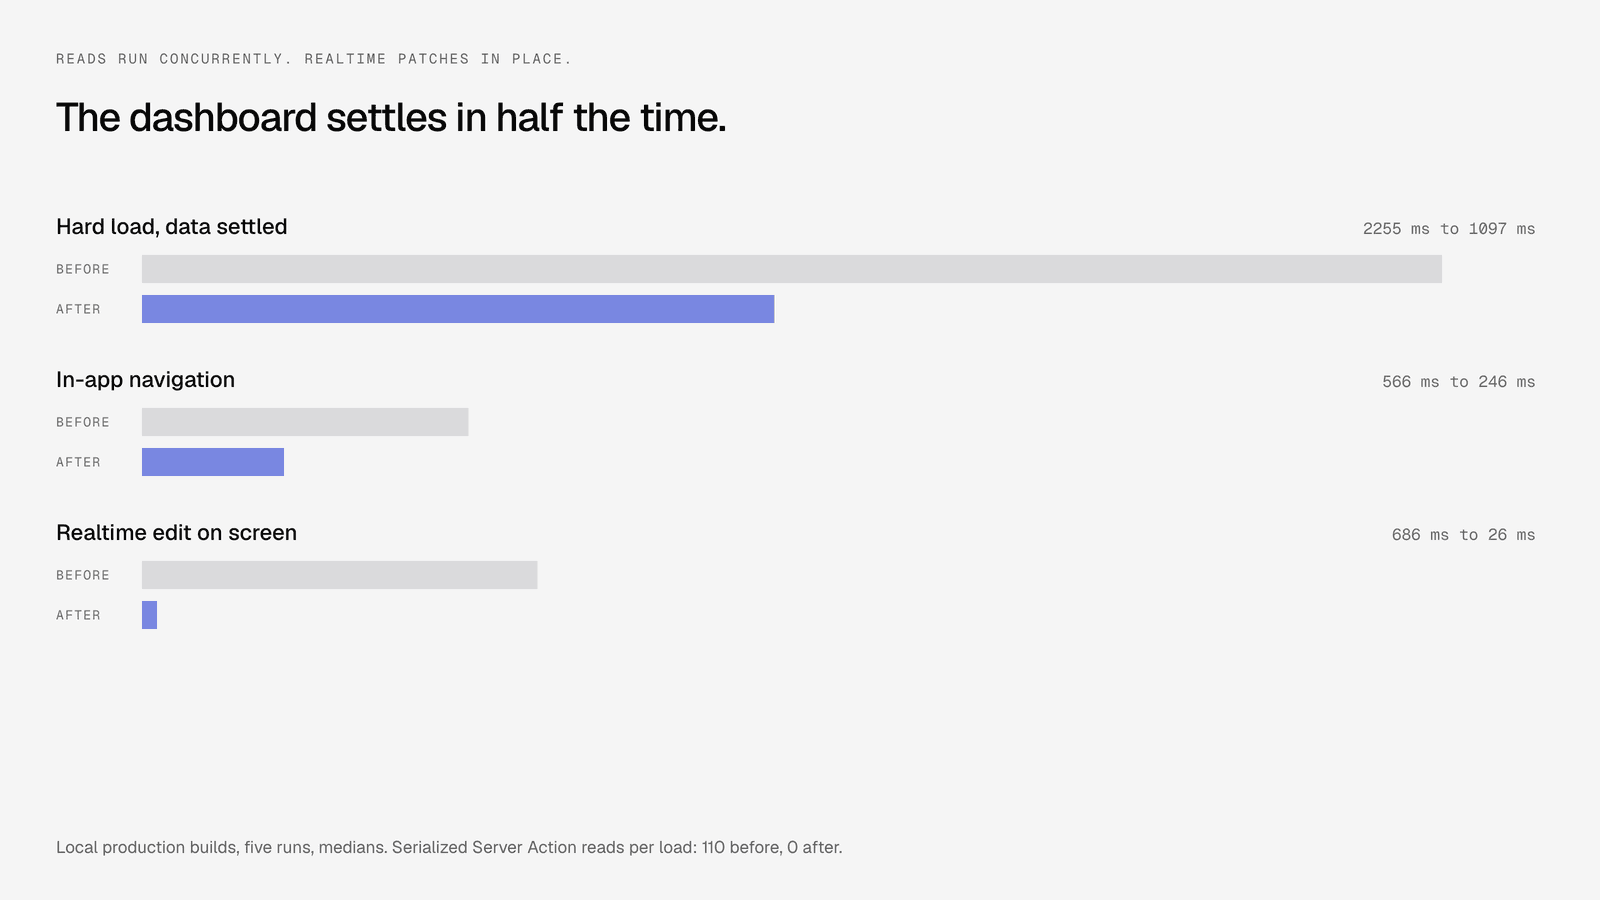
Every number below is our own measurement. The table comes from local production builds, five runs each, reporting medians. Where we re-verified on production, we say so.
Why the dashboard felt slow: Server Actions run one at a time
The dashboard felt slow because every read was a Server Action, and the browser dispatches Server Actions sequentially per tab. The shell painted fast. Then the data behind it settled two to three seconds later, queued behind 10 to 20 serialized calls. The Next.js documentation describes this sequential dispatch and recommends Route Handlers for data fetching ().
The dashboard at v2.starko.one is a Next.js App Router app. Client components read through React Query, and live updates arrive over Supabase realtime. The cost of Server Actions for reads only showed once a screen like the project board needed 10 to 20 reads before it could render a card. Each call was quick on its own. Chained, they were the whole wait.
Round one: a concurrent read channel and realtime patching
Round one moved reads to a Route Handler and stopped realtime ticket updates from refetching whole lists. Together these cut the hard load median from 2255 ms to 1097 ms and in-app navigation from 566 ms to 246 ms on our local production builds.
Reads go through POST /api/rpc, mutations stay Server Actions
Reads now go through POST /api/rpc/<fn>. The handler checks the session, looks the function name up in an allow-list of 42 read functions, runs it and returns the payload with no-store. An expired session gets a JSON 401 rather than an HTML redirect, and an unknown name gets a 404. The list holds no mutations. Writes still use Server Actions, where sequential dispatch is a feature rather than a cost.
Each read function keeps its own workspace and permission checks, so the channel adds a transport without loosening anything. A codemod rewrote the 63 client components and hooks that called actions directly. Ticket views also use a 15 second stale time instead of refetching on every mount, and the project board streams its first page in with the shell.
Realtime edits are patched into the cache
Now an UPDATE or DELETE payload is merged straight into every cached ticket list and the open ticket, using an allow-list of ticket columns. Before this round, a realtime ticket event invalidated the cached lists and triggered a refetch. Fields derived from joins are never overwritten by the payload.
A background refetch is still scheduled when the payload cannot express the result: an INSERT, a change to a column the view filters or groups by (status, assignee, team, project, tags, deadline, archived), a change to files on the open ticket, or an update to a ticket no cached list holds, since it may have just moved into view. The 400 ms debounce and the board-move deferral stayed as they were.
This is the same idea behind and .
What we measured
We measured round one on local production builds, five runs each, and report the medians. These are our numbers for our app, not a benchmark of Next.js in general.
An edit used to take most of a second and a network round trip to reach another screen. After the patcher, it lands in 26 ms with no request at all. Once round two had shipped, we re-verified realtime on production: an edit reaches the screen in 22 to 24 ms, patched in place, with no refetch.
Round two: a persisted query cache and hover prefetch
Round two made a page you have already seen render its last data at first paint. After round one, production hard loads settled in about a second, and nearly all of that second was hydration, then the first query, then the data.
Successful queries persist to IndexedDB
Successful queries are now written to IndexedDB, using structured clone so Dates survive, and restored right after the providers mount. A page you have seen renders its last data immediately and refetches behind it. The realtime patchers keep restored rows live. Restoring never overwrites newer data, so server-streamed results on a hard load still win.
The store is keyed by deployment id, user and workspace, and deleted on sign-out. Recordings, session replay, credits and eligibility keys stay out of it. We deliberately did not gate rendering on the restore finishing, because that changes how pending queries render during hydration and flashes empty states.
In a local Playwright check, after one visit, a reload with every /api/rpc request held for four seconds painted the board's 8 cards 14 ms after load from the store.
Every sidebar route prefetches its exact keys on hover
Hovering or focusing a sidebar link now warms the destination's exact query keys, for home, inbox, conversations, the knowledge hub and the CRM lists. We also found that the conversations server prefetch key had 10 slots while the hook had grown to 12, so it never matched. It does now. The last Server Action reads on hot screens moved to the rpc channel in the same round.
Round three: Starko AI sessions open from a snapshot
Round three made a live Starko AI session open instantly from a durable transcript snapshot instead of re-reading the whole transcript. Opening a session used to fetch the full transcript from the sessions API, up to three sequential pages, and did it twice per open. The snapshot lived in sessionStorage, so a reload or a new tab started cold.
Now each run keeps a bounded localStorage snapshot: the transcript items plus the id of the last stream event as a resume cursor. The newest 6 runs are kept, 300 items each, with long tool outputs capped.
On open, the snapshot becomes the transcript query's initial data, so there is no spinner. The stream reconnects with ?after=<cursor> and the events route replays only the gap. A live run whose snapshot is under five minutes old skips the mount fetch entirely, with a safety refetch every 120 seconds while connected. This builds on the and on the path described in .
What is not done yet
Four things are explicitly still open. Thread, message and comment realtime handlers still invalidate and refetch; only tickets are patched in place today. Lists sorted by updated_at do not reorder on a patched edit until the next fetch. DELETE events on tickets need REPLICA IDENTITY FULL on the ticket table to be delivered, and we did not apply that in this round. And round three's resume-from-cursor path had not yet been exercised against a live session in a browser when it merged.
Why load time matters in a factory
Load time matters because teams live in this dashboard all day, and the factory loop runs through it. turns customer feedback into recommendations, lets Starko AI build the accepted ones in an isolated sandbox, has a reviewer agent verify the result, and ends with a person merging the pull request. Every step is a screen: the ticket, the recommendation, the session, the pull request panel.
The loop from feedback to merged pull request is only as fast as the screens between. A couple of seconds of settling per page, several pages per ticket, many tickets a day: that is a tax on the whole loop. We had already done one pass under . This round fixed the structural reason the shell and its data kept arriving apart. The lesson: measure where the wait actually is before touching queries. Ours was in the dispatch, not the database.
Frequently Asked Questions
Why not keep using Server Actions for reads?
Because the browser dispatches Server Actions one at a time per tab, so a screen that needs 10 to 20 reads waits for them in sequence. Reads now go through an allow-listed POST /api/rpc/<fn> and run concurrently, while mutations stay Server Actions.
Does the Route Handler weaken authorization?
No. The handler checks the session, only functions on a 42 entry read-only allow-list can be called, and every read function keeps the same workspace and permission checks it had as a Server Action. The channel changed the transport, not the rules.
What happens if the persisted cache shows stale data?
A page you have visited renders its last known data at first paint and refetches behind it, and realtime patches keep restored rows live. A restore never overwrites newer data, so a fresh server result always wins, and the store is deleted when you sign out.
Do I need to change anything to get the faster dashboard?
No. First visits are faster because reads run concurrently, repeat visits render from the persisted cache, realtime edits to tickets appear in 22 to 24 ms on production, and reopening a Starko AI session paints from its snapshot.